Academic Databases and the Art of the Overcharge
Clarivate, Elsevier, and the American Chemical Society are comfortable pursuing a strategy of pricing discrimination. But libraries don’t have to go along with it. This data can help.

Clarivate, Elsevier, and the American Chemical Society are comfortable pursuing a strategy of pricing discrimination. But libraries don’t have to go along with it. This data can help.
A fair price is a fine thing. It allows customers to buy with confidence, without worry of overcharge, and it allows vendors to sell knowing the margin will allow them to prosper. In some markets, determining fair pricing is straightforward. Consider how easy it is to check online prices for a pair of shoes. Or to check the price of a house by reviewing what comparable properties have sold for. But in other markets, comparable pricing is not easy to find. The academic library database market is one that holds its secrets close, making it hard for a library to know whether the price it pays is fair.
The database market is served by commercial and non-commercial vendors. They sell essential electronic tools used in academic research, teaching, and patient care. Like most research libraries, our organizations, Iowa State University and the University of Utah, negotiate pricing for a range of different databases. This includes bibliographic databases as well as specialized databases that serve niche communities of chemists, engineers, physicians, political scientists, sociologists, and historians.
Unfortunately, like our peers, we conduct our database negotiations in the dark. Vendors hide pricing behind confidentiality clauses in database agreements, restricting libraries from sharing what they pay. As we and others have pointed out, the information asymmetry this creates greatly advantages vendors during negotiations (Thornton & Brundy, 2020; Bergstrom et al, 2014). As in the academic journal market, lopsided access to information in the database market allows vendors to deploy a strategy of price discrimination, charging not what is fair, but what the customer is willing to pay.
To help libraries avoid price discrimination, we gathered research library pricing for three popular academic databases: SciFinder from Chemical Abstract Services (a division of the American Chemical Society); Scopus from Elsevier; and Clarivate’s Web of Science. The pricing largely came through public records requests to member libraries of the Association of Research Libraries. A few libraries, not subject to confidentiality restrictions, shared pricing with us directly. Pricing, contracts, and key provisions are described in our recent data article (Brundy & Thornton, 2024a), and the full dataset is available in Iowa State’s open data repository, DataShare (Brundy & Thornton, 2024b).
Using this data, we will examine a selection of pricing that demonstrates the range of prices paid by libraries and compare pricing across different institutional factors. We will conclude with tips on how to use pricing data in your library’s next negotiation.
Unlike Scopus and SciFinder Scholar, which are stand-alone products, Web of Science is best understood as a suite of products and services. This makes direct pricing comparisons very difficult, since libraries may subscribe to different combinations of Web of Science products and services. Clarivate, the owner of Web of Science, adds further complexity by not applying a consistent pricing structure to its agreements. For example, one library might receive a bundled price for multiple products, while another might see separate prices for the same products. When pricing is bundled, individual product costs are invisible, making it impossible to understand how the final price was determined.
Because of Clarivate’s inconsistent and complicated approach to pricing, we included an overview pdf document (“Web of Science Product and Service Details”) in the dataset that contains, for each institution, a table showing individual subscribed products, pricing, whether pricing is bundled or split out, and the total price for all products and services. The products and services pricing in the analysis below comes from this overview document.
Figure 1 shows 2022 Web of Science product pricing for six research libraries that license directly with Clarivate. The products in Figure 1 were selected for the sake of this comparison and do not represent all Web of Science products and services subscribed to by each library or detailed in the dataset.
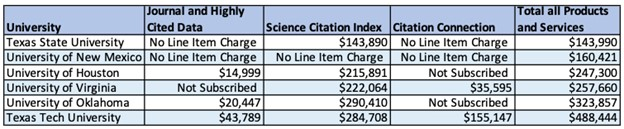
Key Findings from Figure 1:
To allow us to explore how pricing may or may not correlate to institutional characteristics, Figure 2 shows spending on Web of Science per full-time student and spending on Web of Science as a percentage of total library expenditures. If pricing is based on full-time students, we would expect the price per full-time student to remain relatively stable regardless of the size of the institution. (Full-time students and total library expenditures data comes from the 2022 ARL Statistics.)
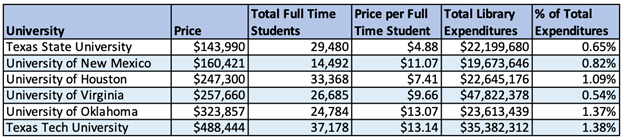
Key Findings from Figure 2:
Scopus, produced by Elsevier, is an abstract and citation database typically used by researchers to conduct literature reviews and analyze citation impact. Since it is a stand-alone product, its pricing is less complicated than Web of Science. Figure 3 shows pricing for libraries that license directly with Elsevier. Similar to Figure 2, it shows spending on Scopus per full-time student and as a percentage of total library expenditures.
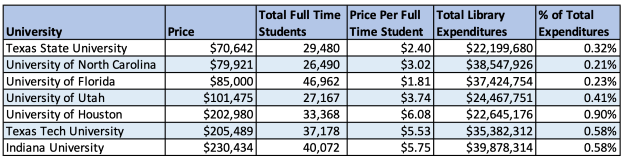
Key Findings from Figure 3:
In explaining pricing, vendors, at times, will connect pricing with research productivity. Thus, another method of assessing whether pricing is fair is to analyze it relative to research publication output. A key question is whether high research output institutions are paying more or less per research publication. The preliminary assumption is that institutions with higher publication output would pay more per publication than institutions with lower publication output.
Figure 4 analyzes article output for seven institutions within a pricing band from $70K to $278K. One limitation of the publications data is that it does not include affiliates that may be associated with the primary institution. For example, totals for the University of Utah do not include the University of Utah Hospital, which is an affiliate of the University of Utah. Another limitation is the small sample size, which limits our ability to generalize the findings to a broader population.
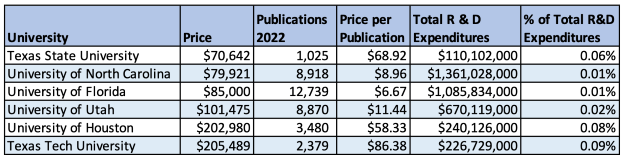
Key Findings from Figure 4:
SciFinder is a database produced by the American Chemical Society that is typically used by researchers to conduct literature reviews and find chemical information. Similar to Figure 2 for Web of Science and Figure 3 for Scopus, Figure 5 compares 2022 SciFinder pricing per full-time student and spending on SciFinder as a percentage of the overall library budget. With the exception of the University of Buffalo, which licenses through NERL (NorthEast Research Libraries), all universities in Figure 5 license directly.
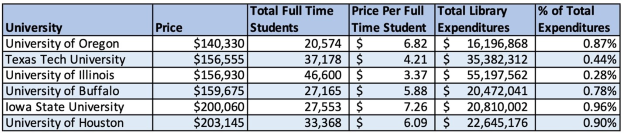
Key Findings from Figure 5:
Similar to Figure 4, Figure 6 analyzes seven institutions with SciFinder pricing ranging from $140K to $203K, looking at price relative to research productivity.
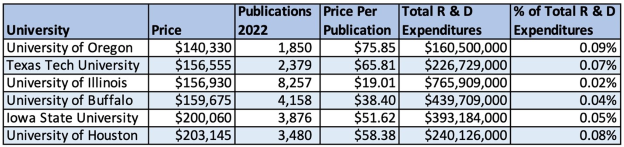
Key Findings from Figure 6:
Clarivate, Elsevier, and the American Chemical Society are comfortable pursuing a strategy of pricing discrimination. But there is no reason libraries should allow this approach.
As we have done, we recommend libraries review their pricing for all three databases. Find comparables and determine whether local pricing is fair. If a library finds it is paying a high price relative to peers, it is possible to use comparable pricing to negotiate a discount. In 2024, Iowa State was able to use SciFinder pricing from the dataset to show we were being overcharged relative to peers. We negotiated a 12.5 percent price reduction.
Clarivate’s approach to Web of Science pricing presents unique challenges. We recommend libraries review the Products and Services tables included in our dataset, as well as their own products and services pricing, to get a better understanding of Clarivate’s different pricing strategies. If Web of Science product pricing is bundled, libraries should ask to have it split out to allow easier comparison. If pricing is already split out, libraries should compare individual item pricing to similar institutions in the dataset.
We also noticed some libraries are charged a technology fee while other libraries are not. For example, Oklahoma’s fee is $13,000 and Texas Tech’s is $4,800. Iowa State and Utah are not charged this fee. Closely scrutinize your library’s Web of Science Product and Services Detail table to ensure that your library is not paying an unnecessary fee.
There are many other comparisons that can be made from the pricing in the dataset and lessons to be gleaned. For example, what is the advantage of licensing directly versus going through a consortium? How prevalent are introductory pricing rates? And what are the trends and averages for inflation cap rates? Alex Lao, from Stanford Libraries, used the pricing from the dataset to create visualizations in Tableau, which are sure to provide additional insights.
Fifteen years ago, in the midst of the Great Recession, the Association of Research Libraries Board of Directors passed a resolution strongly encouraging its member libraries to refrain from signing agreements that restricted the sharing of pricing and terms.
But today, accessing library pricing and terms is as difficult and time-consuming as ever. It took the two of us many, many hours over a two-year period to surface the pricing for these three databases. While this data can provide many insights, research libraries subscribe to dozens of these types of resources. This dataset is only a flashlight glimpse into a darkened room.
If you believe having access to pricing data will support your negotiations, then please take a stand on removing confidentiality clauses. Otherwise, vendors, as we have shown, are happy to overcharge.
Note: This article has been updated to correct an error in data for the University of Illinois that appeared in Figures 3 and 4. The “Total Full Time Students,” “Total Library Expenditures,” and “Total R&D Expenditures” figures presented in those tables reflected only the University of Illinois Urbana-Champaign campus, while the Scopus contract applies to the entire University of Illinois system. As a result, the “Price Per Full Time Student,” “% of Total Library Expenditures,” and “% of Total R&D Expenditures” figures in those tables were inaccurate. Accordingly, we have removed “University of Illinois” from both tables. We regret the error.
Bergstrom, T. C., Courant, P. N., McAfee, R. P., & Williams, M. A. (2014). Evaluating big deal journal bundles. Proceedings of the National Academy of Sciences, 111(26), 9425-9430. https://doi.org/10.1073/pnas.1403006111
Brundy, C., & Thornton, J. B. (2024a). Academic library pricing dataset for SciFinder Scholar, Web of Science, and Scopus: 2018-2024. Journal of eScience Librarianship 13 (2): e959. https://doi.org/10.7191/jeslib.959
Brundy, C., & Thornton, J. B. (2024b). Academic Library Pricing Dataset for SciFinder Scholar, Web of Science, and Scopus, 2018-2024. Iowa State University DataShare [Data set]. https://doi.org/10.25380/iastate.26081797.v1
Thornton, J., & Brundy, C. (2021). Elsevier title level pricing: Dissecting the bowl of spaghetti. Journal of Librarianship and Scholarly Communication 9 (1): eP2410. https://doi.org/10.7710/2162-3309.2410
10.1146/katina-20250226-1
Copyright © 2025 by the author(s).
This work is licensed under a Creative Commons Attribution Noncommerical 4.0 International License, which permits use, distribution, and reproduction in any medium for noncommercial purposes, provided the original author and source are credited. See credit lines of images or other third-party material in this article for license information.