Your Students May Not Have Read the Syllabus. But This Tool Did.
Open Syllabus Analytics is a one-of-a-kind resource that offers promising analysis of millions of syllabi. But the execution disappoints.

Open Syllabus Analytics is a one-of-a-kind resource that offers promising analysis of millions of syllabi. But the execution disappoints.

Open Syllabus Analytics is a multifaceted interface that allows users to explore syllabi in the collection of the research nonprofit Open Syllabus (OS) in a range of contexts: as unique teaching materials that can spark new approaches to subject material; as descriptions of curricular trends in particular institutions, disciplines, or geographic regions; as evidence of the reach of a publication or publication author; and more. In addition to Analytics, OS offers Course Matcher, a tool that helps prospective transfer students assess their ability to transfer credits to destination schools, and Galaxy, a data-visualization of the most frequently cited texts in the OS collection, plotted in relation to academic fields.
Since 2016, OS has gathered English-language syllabi from higher education institutions in 114 different countries, primarily through a twice-yearly crawl of publicly accessible university websites, with a small portion of the collection contributed directly by faculty and institutions; users are encouraged to share syllabi, including through a direct upload link on the Analytics homepage. OS notes that the currency of their collection is generally delayed by about one year. OS aims to make their collection useful to several audiences: instructors, librarians, publishers, students, and university administrators (Open Syllabus, n.d.-b).
OS utilizes machine learning and other techniques (such as manual rules-based processing) to analyze the syllabi, with a particular focus on details of the assigned publications but also including metadata like course titles, course descriptions, learning outcomes, and academic fields. OS notes the difficulty in accurately assessing which academic field a course fits within, given the “great deal of variation in how different educational systems and intellectual traditions divide human knowledge,” and highlights the particular challenge of accurately determining academic fields from materials of non-Anglophone institutions (Open Syllabus, n.d.-b).
At the time of this writing, Analytics only surfaces about 12 million syllabi of the 21 million in the collection: while all collected syllabi contribute to citation counts for titles, only those with date and description information are displayed (Open Syllabus, personal communication, March 10, 2025). Syllabi authors are anonymized, though users can navigate syllabi by region, institution, and academic field; users can also explore gender statistics for authors of both syllabi and cited titles. Note that gender statistics are generated through processes of first-name-to-gender inference, which OS acknowledges can lead to predictions that are “incorrect and harmful” (Open Syllabus, n.d.-c).
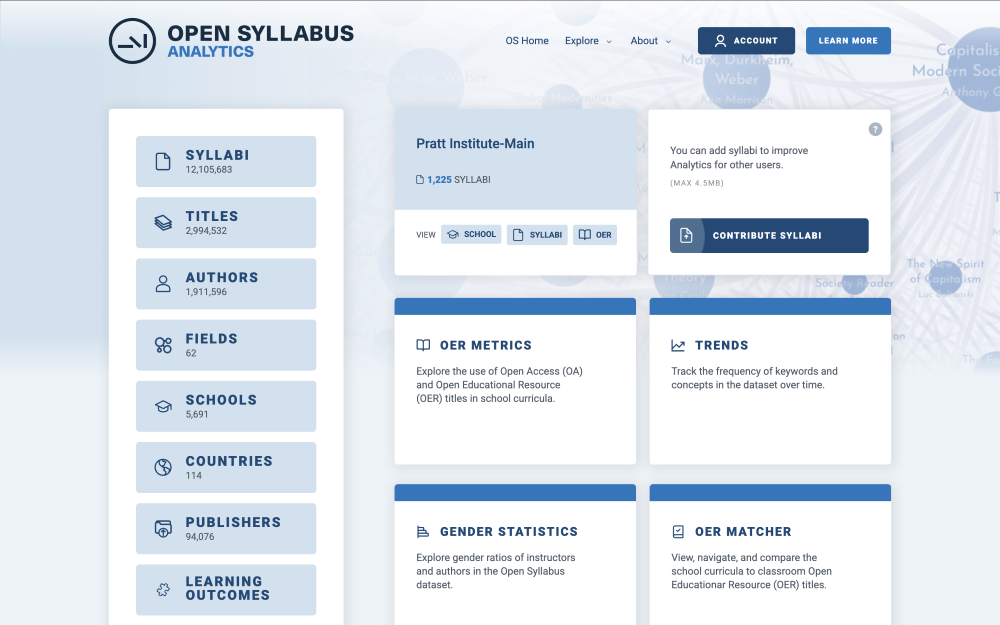
The Analytics homepage offers multiple avenues into the collection (Figure 1). On the lefthand side of the page is a menu bar listing several different data categories, including syllabi, publication authors, countries of origin, and more. Clicking a category opens an unfiltered search results page with a facet menu on the lefthand side, and, to the right, the top fifty items in that category according to “rank,” though, per OS, syllabi aren’t actually ranked as such, but simply ordered by most recent year. For other data categories, like country, field, and institution, results are ranked by the number of syllabi attributable to each (Open Syllabus, personal communication, March 10, 2025).
Returning to the homepage: the body of the homepage includes a handful of cards showing different collection features, such as “OER Metrics” and “Gender Statistics” (Figure 1). When signing up for a free, 30-day trial of the Subscription tier, I had configured my account with my name, email, affiliation (“Pratt Institute Libraries”), and position. On logging in, I saw that my home institution was highlighted in the top card, so my journey through the collection began there.
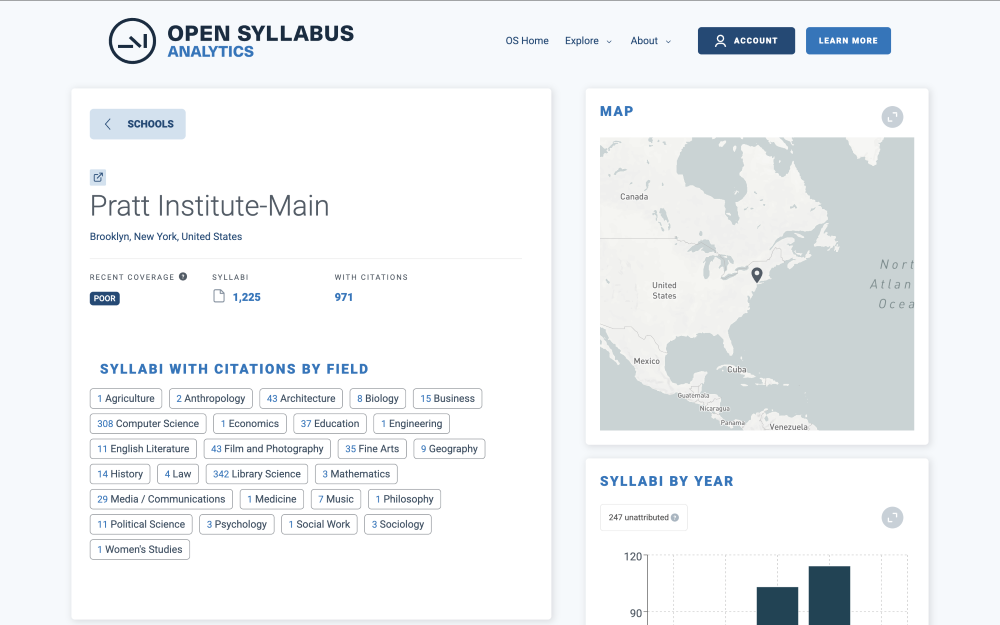
Clicking “School” displayed Pratt Institute’s representation within the collection (Figure 2). A “Recent Coverage” flag indicated that our syllabi coverage was “poor;” a tool tip described this data point as a “rough estimate” of coverage completeness, though did not elaborate on how this determination was made. Also included was an overall count of Pratt’s syllabi—1,225—as well as a subset count of those syllabi with citations—971. OS claims that their data processing produces about 90 percent accuracy for properly identifying citations, with another 8–9 percent “cleaned through rule-based and hand-composed blacklists” (Open Syllabus, n.d.-b). Other graphics on the page displayed breakdowns of Pratt’s syllabi by field, by year, by field and year, and with Open Access/Open Educational Resource titles.
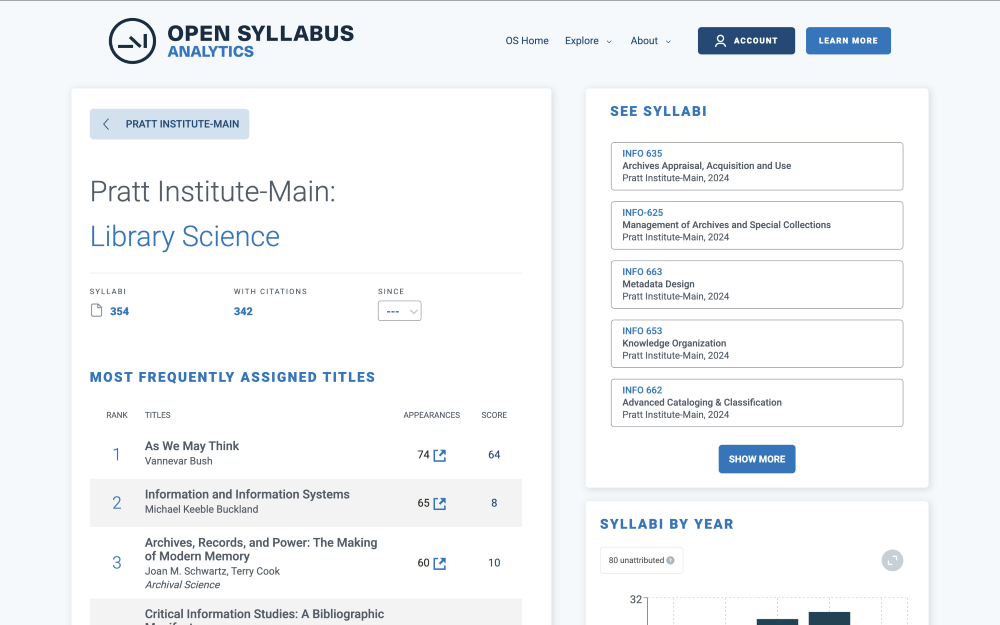
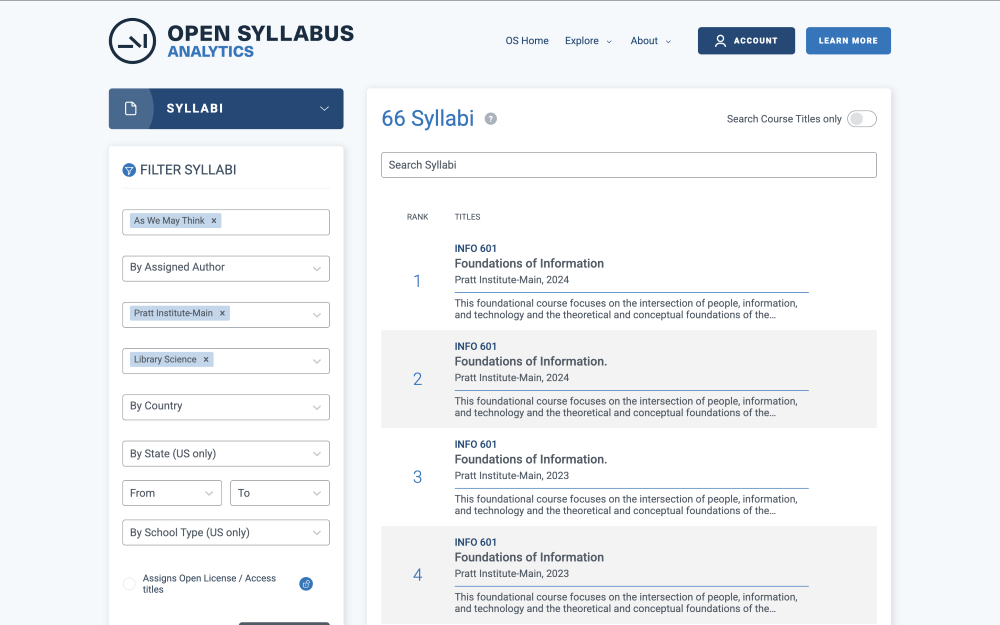
Clicking “Library Science” from the “Syllabi with Citations by Field” breakdown displayed information on the subset of Pratt’s syllabi pertaining to library science, including most frequently assigned titles and a preview of information on some of the collected syllabi (Figure 3). On clicking the top title, “As We May Think” by Vannevar Bush, I received an application error (an error that repeated itself every time I clicked on a title from an institutional field page). Clicking the “appearances” count of 74 next to that title opened the search results page mentioned earlier, with filters confirming that I was seeing only syllabi from Pratt for library science courses that assign Bush’s “As We May Think” (Figure 4). Note that while “Pratt Institute-Main: Library Science” page claims 74 appearances of this title, only 66 syllabi are displayed on the search results due to the display criteria mentioned above.
Here, one is able to search via course titles only, a feature I imagine would be particularly helpful for collection assessment. Clicking into a course title reveals a clear, succinct representation of the syllabus, including a brief course description, learning outcomes, and titles cited (Figure 5).
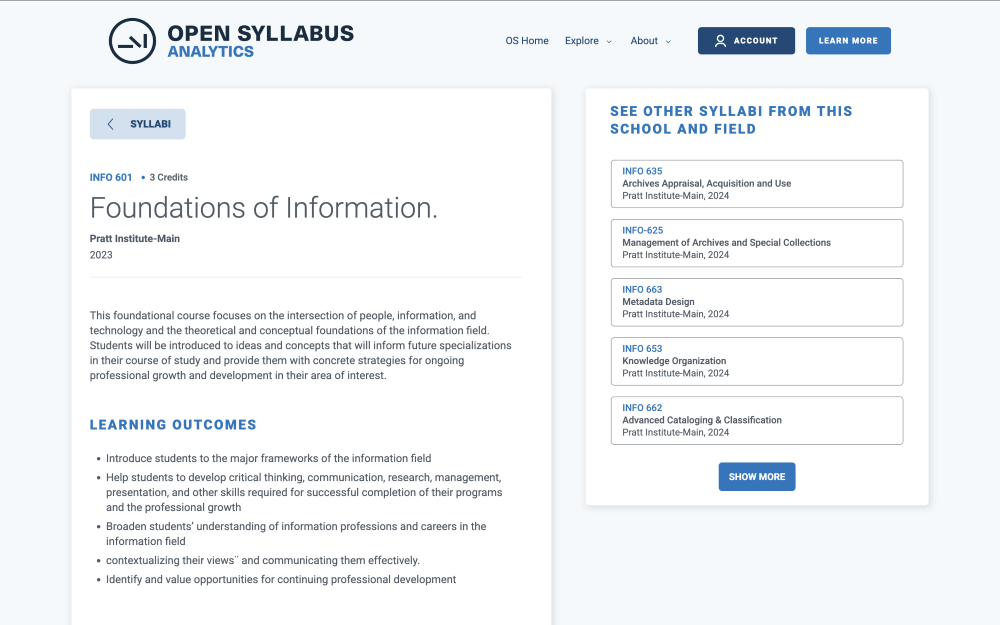
Titles cited were not organized alphabetically by either title or author, so I assume that these are displayed in order of appearance. However, no information delineated any kind of groupings of titles, so it remained unclear which titles may have been assigned during a given week of a course.
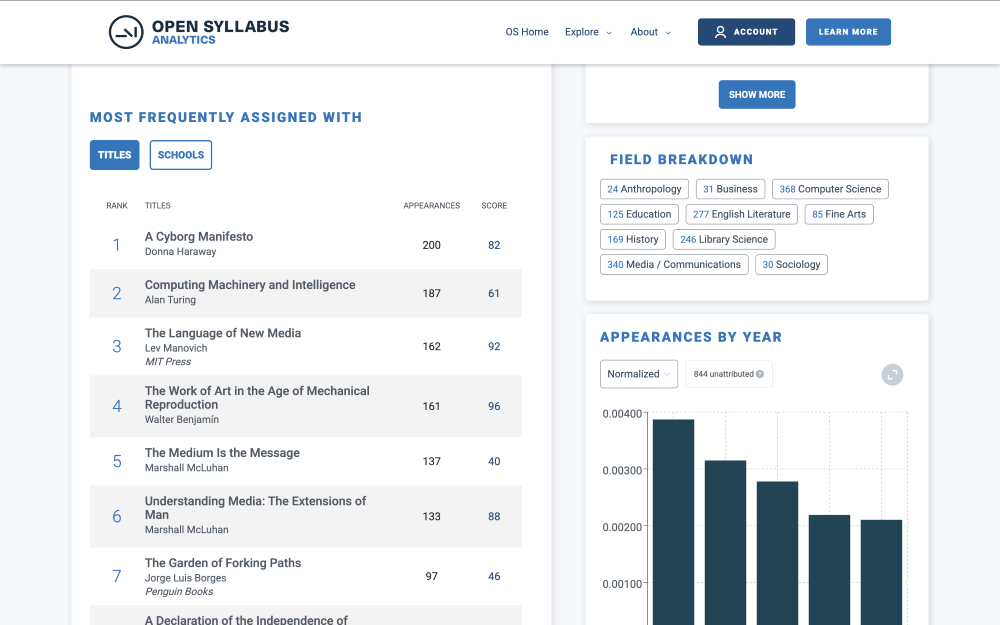
Frustrated that clicking the title of “As We May Think” by Vannevar Bush from the “Library Science” page had produced an error, I navigated back to the Analytics homepage, and then to the “Titles” search page. When put into the search bar, “As We May Think” produced three title results, the top one being Bush’s, which led to a title-specific page that included a feature that really excited me: a breakdown of other titles that “As We May Think” was “Most Frequently Assigned With” (Figure 6).
Interested in exploring the collection from another angle, I once again returned to the homepage and navigated to the “Countries” search page. I then clicked “Micronesia,” and was taken to a broad overview of the collected Micronesian syllabi (Figure 7).
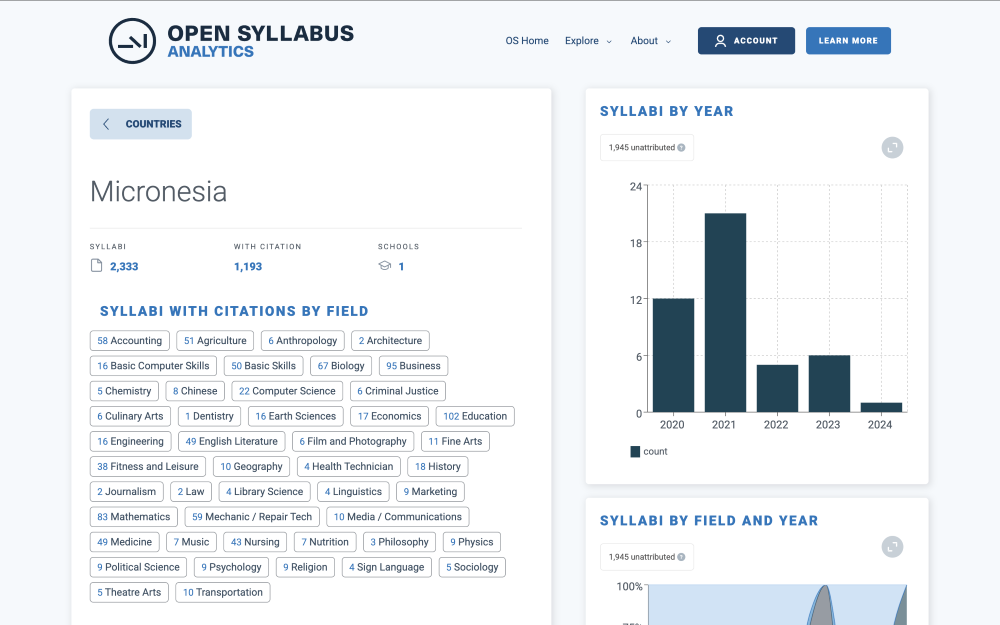
Clicking into the first academic field, “Accounting,” I was brought to a page that showed me only the most frequently assigned titles from these syllabi, as well as a breakdown of syllabi count by year. There was no way to see the syllabi themselves from this page; instead, I had to navigate to the “Syllabi” search page and choose Micronesia from the “By Country” facet dropdown.
Overall, Analytics is easy to use, perhaps aided by the simple sparsity of content. As noted, however, some of the data presented would benefit from clarification. The errors I encountered while attempting to navigate to publication titles were also frustrating.
Pricing for Analytics is transparent and easy to understand. There is a 5-tier annual subscription model for schools based on size of the student body: $2,500 for fewer than 5,000 students; $5,000 for between 5,000 and 20,000 students; $7,500 for more between 20,000 and 50,000 students; $10,000 for more than 50,000 students; and $200 for use by staff at high schools. A 3-tier annual subscription model exists for publishers and other organizations, based on annual revenue: $2,500 for organizations making under $5 million; $5,000 for organizations making between $5 million and $25 million; and $7,500 for organizations making more than $25 million in revenue. Two-year schools receive a 30 percent discount, and schools in middle/low-income countries receive a 50 percent discount. The site also notes that “[p]ricing can be discounted for consortia and other factors” (Open Syllabus, n.d.-a).
A free experience is available that only shows data up to 2019 and doesn’t show syllabi or learning outcomes, among other features. Thirty-day free trials of the subscription experience are available.
By default, Analytics authenticates users against institutional email domains: anyone with an email address from a subscribing institution is granted an account and full access. OS is also able to set up SAML-based single sign-on protocols like Open Athens on request (Open Syllabus, personal communication, March 10, 2025).
Though many higher education institutions archive their course syllabi and publish them online, no other project attempts to present and analyze a global, cross-institution syllabi archive at this scale.
Analytics is a resource that enables unique possibilities. At this scale, it presents a one-of-a-kind collection of a ubiquitous teaching artifact and provides interactive tools exploring useful points of analysis that are easy to imagine integrating into the workflows of several professional and academic roles. Publishers and institutional administration might use this tool to assess the research impact of their authors and their faculty, respectively, through the tangible metric of citation count within the collected syllabi. Librarians whose institutions have a healthy coverage within the collection can make efficient assessments of what is being taught in their own schools or at other institutions. Instructors can learn from what peers are teaching in different courses and disciplines, and encounter both common and novel connections between particular titles. Analytics supports these distinct yet overlapping endeavors through a concise and versatile interface.
The presentation is unencumbered, displaying the content simply and legibly, and according to its VPAT, Analytics largely conforms to the Web Content Accessibility Guidelines (WCAG) Guideline 2.4, level AA.
The execution of this product, however, leaves much to be desired. As mentioned previously, a few aspects of OS’s analysis would benefit from fuller elaboration within the interface. Additionally, several moments of the user experience were clunky, including consistent errors on an important function (navigating from an institutional field page to a title page). The interface also lacked easy connection points I would have expected to find, such as moving directly from a country page to a page displaying that country’s collected syllabi.
Note also that OS’s analysis of its data can lead to confusing results, even in simple searches. When I searched for data on library and information sciences scholar David James Hudson via the “Author” search page, zero results surfaced. I was able to find Hudson’s article “On Dark Continents and Digital Divides: Information Inequality and the Reproduction of Racial Otherness in Library and Information Studies” (Journal of Information Ethics, 2016), with his name listed as “David Hudson.” On clicking through to the “David Hudson” author page, I found over 200 titles, many of which were not written by the “David James Hudson” I intended to find and with no way to successfully differentiate one David Hudson from the next. Given the machine learning processing of untagged texts, it seems likely that one would run into many such instances within OS data. This, of course, undermines the tool’s usefulness toward any of the applications discussed above.
Given its uniqueness, Open Syllabus Analytics may be a platform worth investing in for your institution. Analytics does give insight into what is being taught at the university level and offers some context. But OS should work on improving its user experience, communicating more clearly how it arrives at its data, and how it then chooses to present that data, and developing a more accurate means of processing and surfacing the complexities of its data set.
Open Syllabus. (n.d.-a). Pricing. Retrieved February 15th, 2025, from https://analytics.opensyllabus.org/pricing
Open Syllabus. (n.d.-b). What is Open Syllabus? Retrieved February 15th, 2025, from https://blog.opensyllabus.org/about-os
Open Syllabus. (n.d.-c). Gender Statistics. Retrieved March 19th, 2025, from https://analytics.opensyllabus.org/gender
10.1146/katina-032525-1
Copyright © 2025 by the author(s).
This work is licensed under a Creative Commons Attribution Noncommerical 4.0 International License, which permits use, distribution, and reproduction in any medium for noncommercial purposes, provided the original author and source are credited. See credit lines of images or other third-party material in this article for license information.