As Portland Press transitions to Subscribe to Open, we are rethinking how to measure and report usage so we can demonstrate that open access—and the spending of the libraries that support it—is improving the global reach of our articles.
This year, we at Portland Press (publishing on behalf of the Biochemical Society) will convert our hybrid journals to Subscribe to Open (S2O). Going forward, if we receive sufficient renewal commitment from our library funder base, the contents of each annual volume will be published open access (OA). If successful, this radical shift in business model will remove paywalls for all of our content.
While we don’t know what effect this transition will have on usage of journal content, we believe S2O should fundamentally change how we report on, and how institutions interpret, usage statistics.
The first phase of our transition to open began in 2020 and relied heavily on read and publish (R&P) agreements, an uncapped version of the model created collectively in 2019 by independent societies working within a newly formed Society Publishers’ Coalition. The focus of measurement and determiner of success of these agreements has been the number of articles immediately published OA by authors at participating institutions. To some extent, the uptake of article publishing charges (APCs) had already caused a shift away from evaluating deals on read access alone to also including publication output. As OA is becoming more widespread, we believe another change is underway, with global usage becoming an important consideration for librarians managing OA agreements (as evidenced by the focus on global usage in COUNTER Release 5.1).
The shift in the way that we structure and fund OA has included removing APCs and will result in more (potentially all) of our content being OA immediately upon publication. Usage must therefore become the primary yardstick by which we measure and report on the success or failure of our OA transition. Furthermore, as a publisher with a strong portfolio of review journals, which commission and publish articles in order to spread understanding of our subject, we have a particular interest in charting our content’s use and reach.
As Release 5 of COUNTER acknowledged in 2017, and as Release 5.1 (which was published in May 2023 and came into force in January 2025) emphasizes, measurements need to substantiate the claim that OA drives increased usage. (A quick rudimentary analysis of usage and citation data shows that OA articles published in Portland Press journals have on average 1.5 times more citations and almost 5 times more downloads than non-OA articles.) COUNTER 5 includes instructions to attribute usage not tied to an institutional customer to “The World”—that is, to create a global report that an institution can use to evaluate usage in its region as well as across the world.
To lay a foundation for the move toward a wider, possibly global, evaluation of readership and impact, we will explore the effect on usage of two key events from 2020—the temporary removal of paywalls during the COVID-19 lockdown and the introduction of R&P agreements—and identify usage trends that may hold some clue as to how usage might change once more of our content either becomes OA or is paywalled, depending on the result of S2O collective action. We’ll also describe how we’re using dissemination platforms to maximize the reach of the research we publish.
Usage On Our Platform: 2020–2024
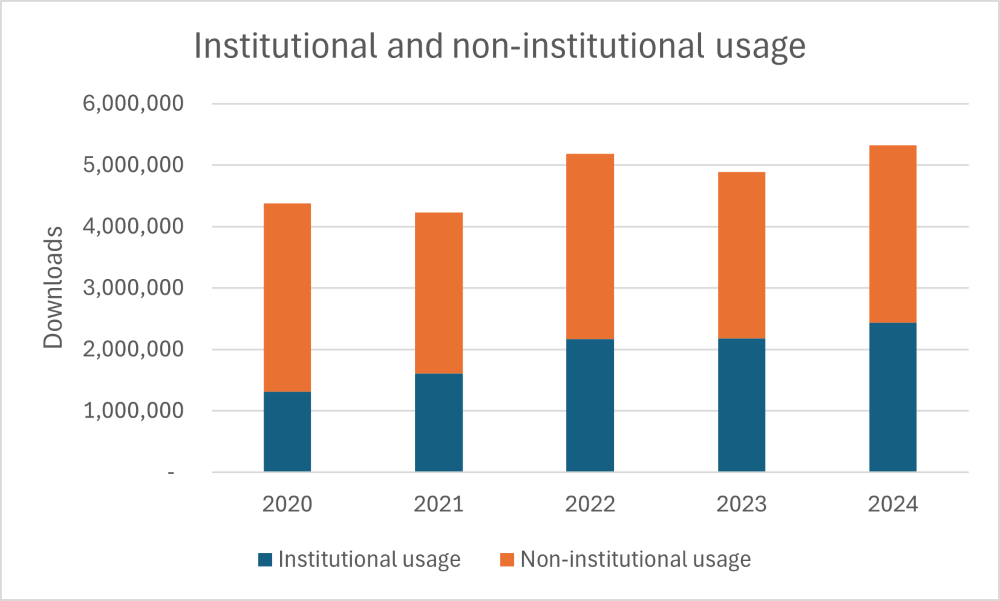
Figure 1 shows content usage patterns on Silverchair, our journal platform, over the past five years.
FIGURE 1: Institutional and non-institutional usage 2020–24
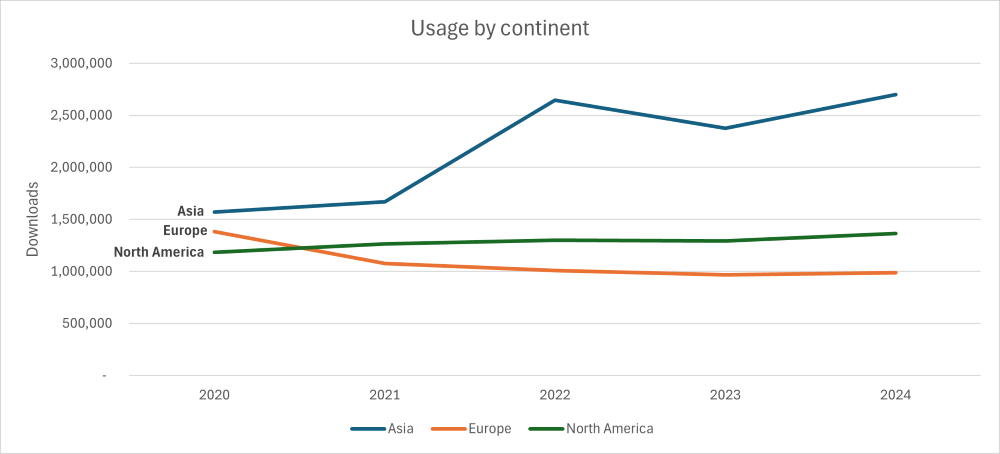
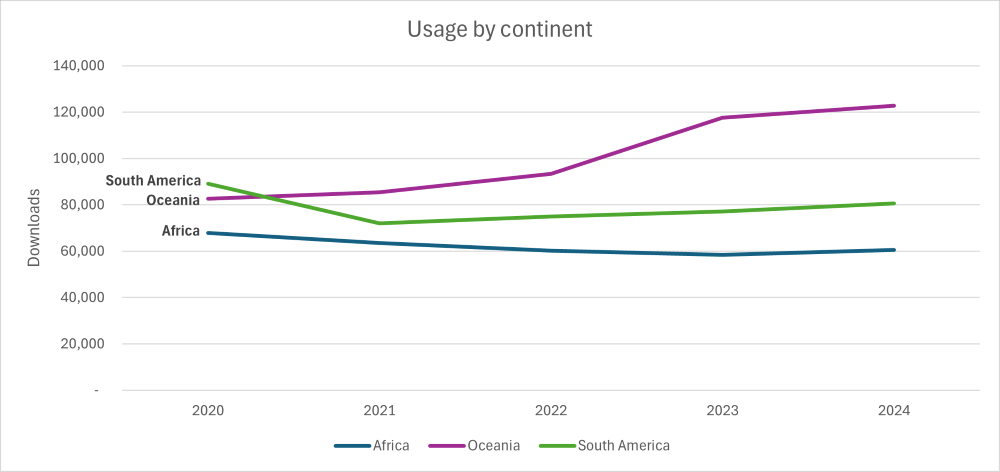
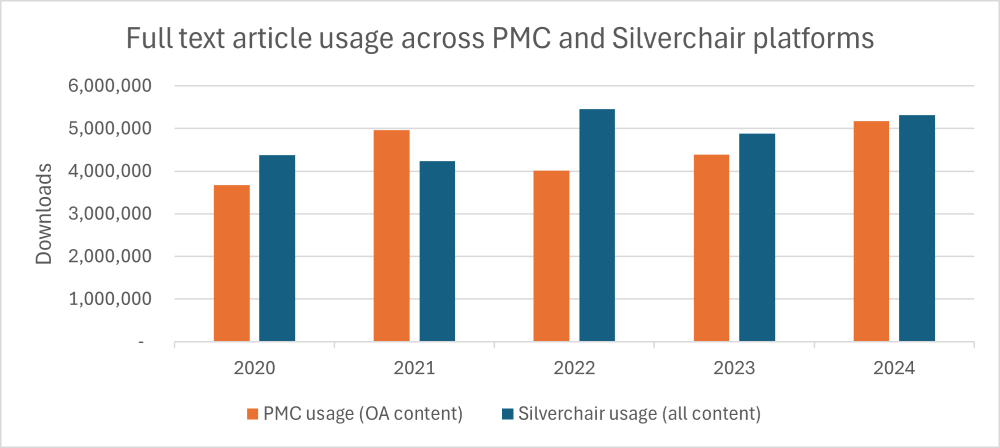
Full-text usage of Portland Press journal content via the platform has increased over a 5-year period by 16 percent. Regionally, Asia and Oceania have shown the strongest growth in usage, particularly China, where usage doubled between 2020 and 2024 (see Figures 2A and 2B). During the same period we’ve also disseminated our content through PubMed Central (PMC) which has contributed comparable levels of usage to our own platform and has shown an even higher overall increase across the same period (see Figure 3 below). Unfortunately, geographic breakdowns are not possible for PMC usage statistics.
FIGURE 2A Regional usage trends.
FIGURE 2B Regional usage trends.
FIGURE 3 Usage 2018–2024 across journal platform (Silverchair) and PMC
Focusing on 2020, the beginning of the period we are studying, we examined two events that impacted usage, and which we think may provide an indication of future trends:
The temporary removal of paywalls during the COVID-19 lockdown.
The introduction of R&P agreements and subsequent increase in OA publishing.
Lockdown Year and Effect on Usage
During the summer of 2020, Portland Press, like many publishers, temporarily made all content freely available to enable scientists to continue working from home during the COVID-19 lockdown. Several years on, data from this period provides an interesting natural experiment that allows us to observe the effect of instantaneously opening large amounts of content.
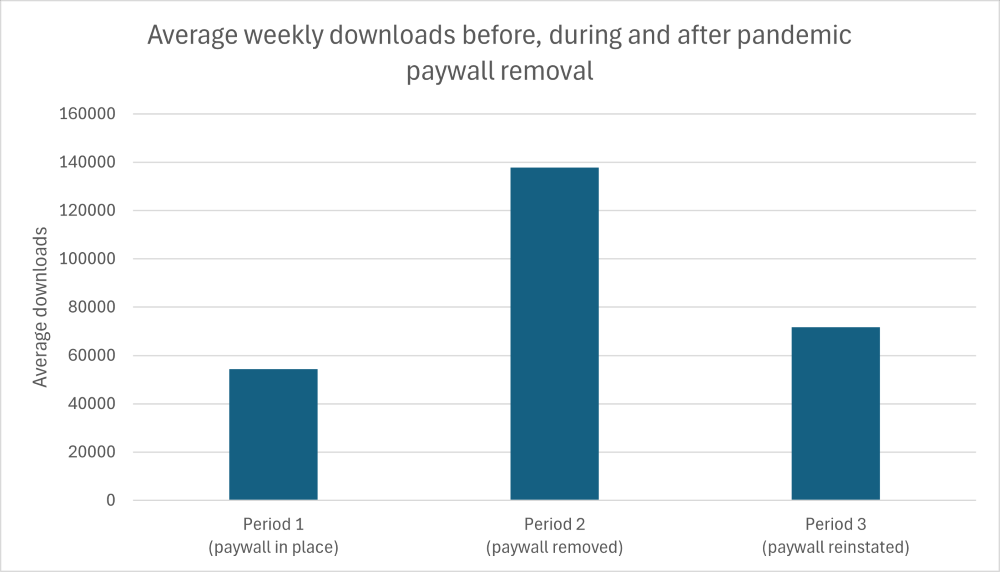
Figure 4 shows the average number of weekly downloads (as recorded by Silverchair), before, during, and after the removal of the paywall. During the paywall removal period, downloads were 141k, compared to 54k in the 16 weeks of 2020 preceding the paywall removal and 72k in the 21 remaining full weeks of 2020, after paywalls were reinstated. Usage during the paywall removal period was also higher than usage across the same period in any subsequent year (up to the end of 2024). While there was a brief spike in usage of content mentioning “COVID” or “coronavirus” in the first weeks of the pandemic, usage also increased generally across subjects.
FIGURE 4 Usage during the COVID-19 lockdown; average weekly downloads.
Breaking down 2020 into these 3 periods (1: pre-paywall removal, 2: the paywall removal period itself, 3: the period after the removal when the paywall was reinstated) provides a good basis on which to examine the effect of paywall-free full OA on the journals published by Portland Press.
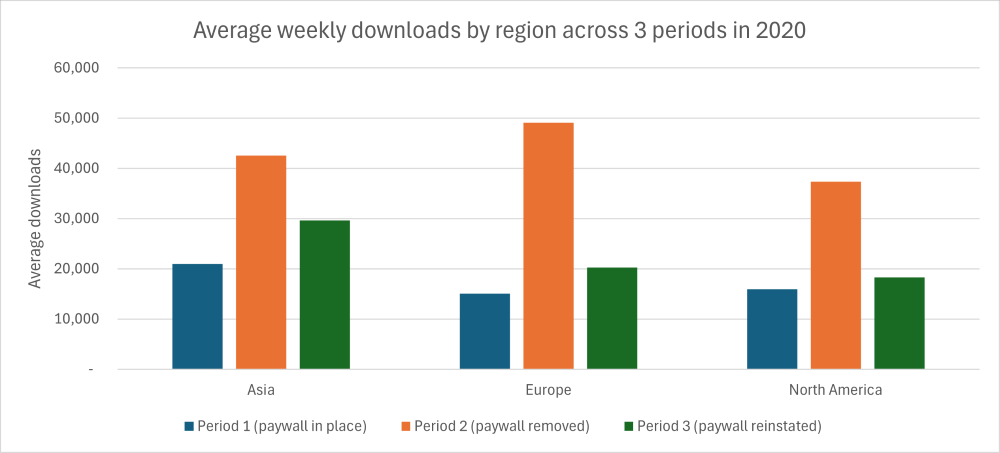
Our organizational mission includes the promotion of equity, which we approach in part by adopting business models that promote greater access; accordingly, we wanted to understand whether the increased usage we saw during the paywall removal period represented untapped demand in parts of the globe where financial barriers exist.
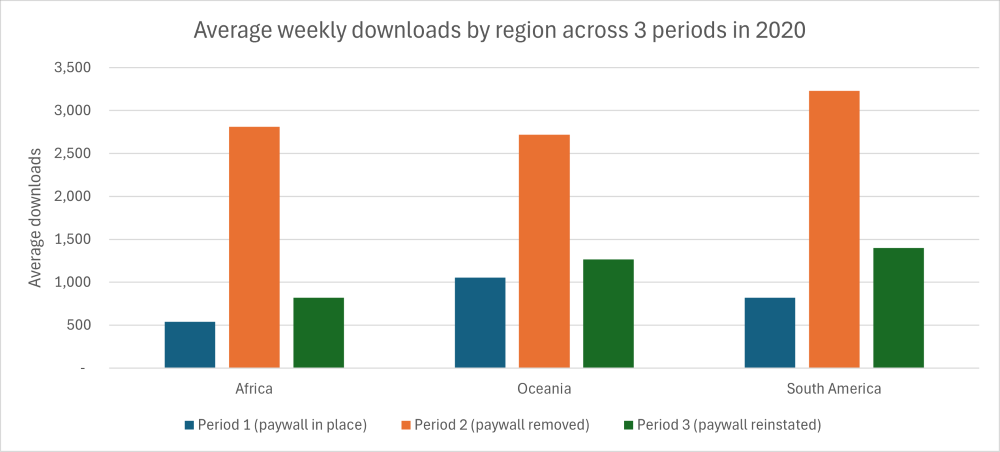
Looking at average weekly usage by region over these periods highlights the geographic differences in usage. Across all regions, usage increased in period 2, when paywalls were dropped, but the scale of the increase varied between regions. Regions with lower subscription rates, less access to content, and lower usage overall, such as Africa and South America, showed the greatest percentage increase in usage when paywalls were removed.
FIGURE 5A Differences in regional usage during the lockdown; average weekly downloads
FIGURE 5BDifferences in regional usage during the lockdown; average weekly downloads.
As we roll out S2O we shall continue to monitor the regional differences in usage.
Read and Publish
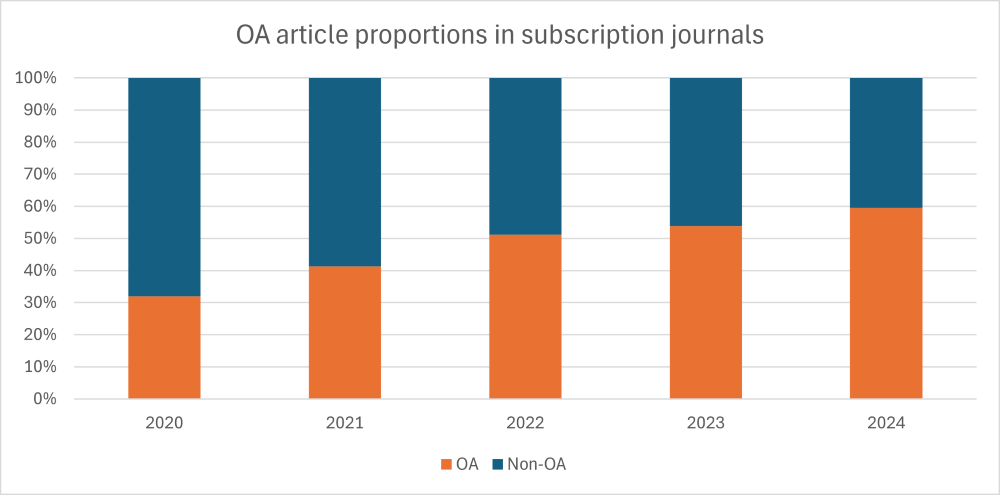
Since we introduced R&P in 2020, an increasing proportion of our articles has been published OA. Figure 6 illustrates this change.
FIGURE 6 OA vs non-OA articles published in subscription journals 2020–2024
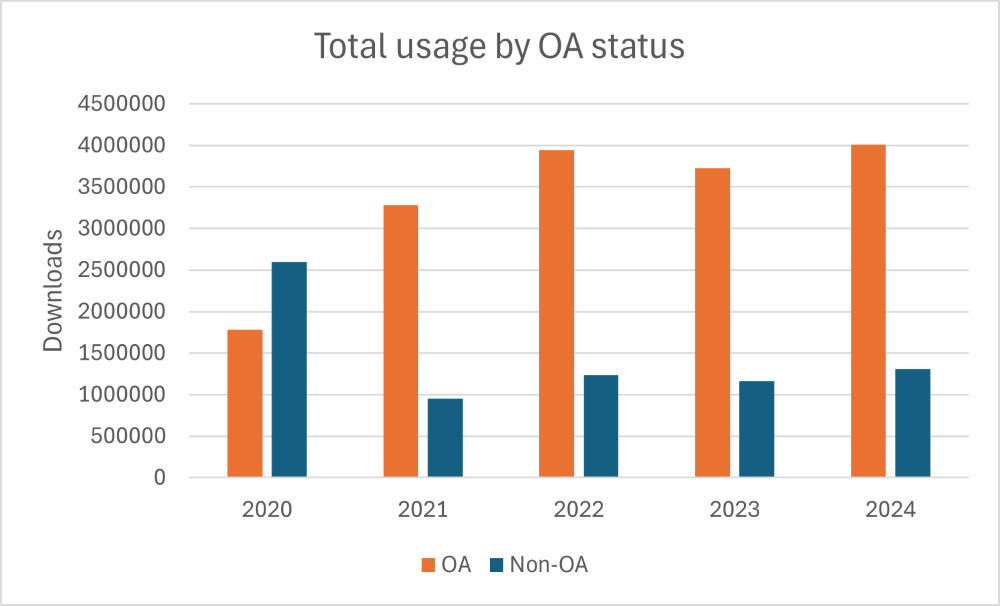
FIGURE 7 Total usage broken down by OA and non-OA content
Figure 7 shows the increasing usage of OA content (orange bars) over the past five years. The blue bars represent usage of paywalled content. It is worth noting that 2020 is an outlier year, as opening of content during the lockdown period was done without changing the actual underlying OA status of the articles, and so articles are measured as non-OA content despite having been free to read.
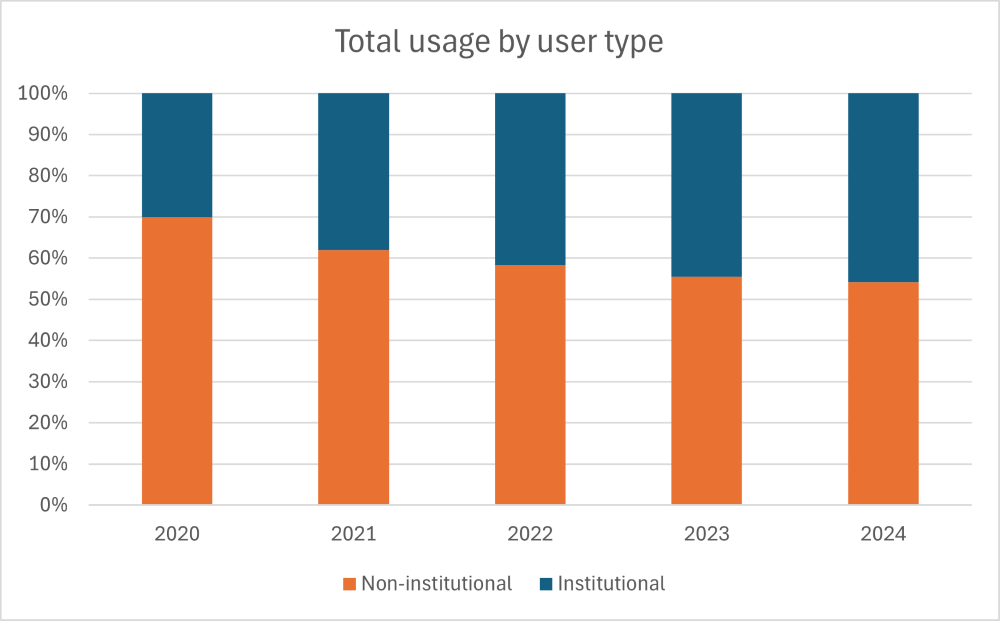
While we might expect access by institutional customers to decline as a proportion of total usage as we publish more OA, it has in fact risen over the last five years, as shown in Figure 8.
FIGURE 8 Access by subscribing and non-subscribing institutions.
A couple of possible factors might explain this effect:
Relatively more OA content is read on platforms other than ours and is therefore not reflected in our own COUNTER reports.
Those at subscribing institutions, however, may be more used to and more likely to visit via our own journal platform.
Increased OA usage may be coming from institutions only partially subscribing to our journals who are now benefitting from wider access to content.
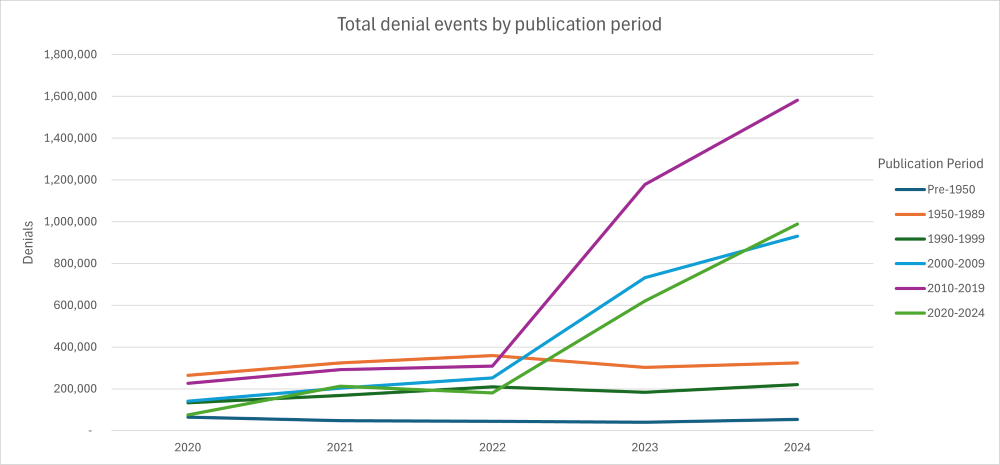
A final feature of the usage patterns on our platform during this period is an increase in denial events, both those experienced by institutional subscribers (who may only have access to current articles or part of the archive) and by those who have no access rights to any of the paywalled content. While a greater proportion of content being published is no longer restricted, OA content published in the last five years is a relatively small proportion of the total content on our platform; the increased denial events are mainly related to content from the years preceding the accelerated transition effort that began in 2020. Increased off-campus research may also be a contributing factor.
FIGURE 9 Denial events by period of publication.
Figure 9 provides a view of denial events broken down by period in which content was published. Figure 9 shows that much of the increase in denials is due to attempts to access content published between 2010 and 2019—a subset of content on which our recent OA agenda will have had no impact in terms of widening access.
Increasing denials demonstrate increased demand and discoverability. We shall continue to use this data to understand patterns and to reach out to customers who require access.
Access from Anywhere
To broaden discovery and dissemination of our content, Portland Press has actively encouraged indexing of and full-text access to our OA articles on aggregator platforms, including PMC and EBSCOhost. In 2024 we signed an agreement to pilot indexing and dissemination of OA content via ScienceDirect, and we will be actively evaluating other options over the coming year. This effort should enable researchers, particularly those in Asia, to more readily view our articles. With each syndication agreement (including ScienceDirect and PMC) we ask for usage, preferably COUNTER-compliant usage reports.
Through this activity (and the usage monitoring we will undertake) our aim is to demonstrate the effect on usage of opening up more content than ever before. We also hope that more aggregators will adopt the COUNTER best practice guidelines for syndicated usage, ensuring publishers can track usage consistently across platforms.
As more content is OA, we expect that:
We will see usage grow from more sites, including platforms with which we have formal agreements and, potentially, others with whom we have no contact.
We expect to see referrals drop from discovery sites to our platform.
Previously syndicated content includes both open and paywalled content, with closed articles linking back to our journal platform, where users can authenticate to gain full-text access. As more content is made OA on external platforms, referrals to and usage from our own journal platform may drop. This would be a positive development for researchers, whose user journeys will improve. In combination with charting usage, getting more detail on referrals may help us to look at other syndication opportunities. Currently most referrals to our content come via the below databases and syndication platforms:
PubMed
Google Scholar
Web of Science
ResearchGate
ScienceDirect
Conclusion
S20 will fundamentally change how we report, and how institutions interpret, usage statistics. This will not only allow us to measure the success of our mission to remove access barriers to vital research, but will also offer academic institutions who actively support equity and inclusion proof that their subscription spending is improving the global reach of articles published in our journals.
Going forward, even if the COUNTER reports librarians pull show diminishing usage at a given institution, our hope is that seeing usage at the country level helps librarians to identify “probable” usage from institutional scholars in the direct geographic area; that global usage of individual articles allows librarians to chart the reach of articles published by scholars at their institution; and that usage metrics help to substantiate the value of their collective action for societal good.
10.1146/katina-032025-1
Gaynor Redvers-Mutton is associate director of business development and sales at the Biochemical Society and Portland Press. Gaynor focuses on ensuring a sustainable pathway toward openness and exploring new business ideas to support the charitable objectives of the Biochemical Society. She has previously worked at the Microbiology Society, Highwire Press, and Wiley.
Ciaran Hoogendoorn is insights manager at the Biochemical Society and Portland Press. His role centers around reporting and analytics, covering the day-to-day running of publishing operations as well as helping to inform key strategic decisions for the Society, particularly around achieving and maintaining open access across the journal portfolio.
Thank you for your interest in republishing! Anyone is free to use and reuse the article text and illustrations created by Katina for non-commercial purposes under a CC BY-NC license. Please see our full guidelines for more information. Photographs and illustrations are not included in this license. This HTML is pre-formatted to credit both the author and Katina.
This is a required field
Please enter a valid email address
Approval was a Success
Invalid data
An Error Occurred
Approval was partially successful, following selected items could not be processed due to error